“Skin in the Game” A live look at my personal investment portfolio. Every investment decision leaves a trace — a date, a price, a return. Since March 2022, I’ve been recording every one of mine. Not to prove a point, but because I believe that transparency is rare in investing, and that tracking your own performance honestly is the first step to getting better at it.
I’m Theodoros — a finance professional with a background in corporate finance, strategy, banking and M&A. Investing has always been both a professional interest and a personal passion, and this dashboard is where those two worlds meet.
Explore monthly returns benchmarked against 11 major global and regional indexes, year-by-year rebased performance, current holdings breakdown by sector, industry and country, and key metrics including Total P&L, Dividend Gains and Time-Weighted Returns.
The full version runs on a private custom-built Plotly Dash application — this is the public, shareable version. Whether you’re here for the markets, the data, or just curious — welcome.
Contents
Power BI Dashboard
How the Numbers Work
Power BI Page 1
Time-Weighted Return (TWR)
TWR measures the compound growth of the portfolio independently of cash flows (deposits or withdrawals). This makes it the industry standard for evaluating investment manager performance — it answers the question “how well did the investments perform?” rather than “how much money was made?”. It is calculated as:
$$\text{TWR} = \prod_{p=1}^{n} (1 + R_p) – 1$$where \( R_p \) is the return of each sub-period between cash flows.
Current Holdings
The holdings breakdown gives a snapshot of the current portfolio composition by sector, industry and country. The percentage allocations reflect the current market value of each position relative to the total portfolio — giving a clear view of geographic exposure, sector concentration and investment style. Individual asset-level holdings are available in the private version of this dashboard.
Power BI Page 2
Monthly Returns Heatmap
Each cell represents the compounded return for that month, calculated as:
$$\left(\prod_{t=1}^{n} (1 + r_t) – 1\right) \times 100$$where \( r_t \) is the daily return on day \( t \).
Daily returns are chained multiplicatively — not summed — to accurately reflect compounding. For my Portfolio specifically, the monthly returns reflect the TWR methodology, meaning cash flows such as deposits or withdrawals do not distort the performance figures — it purely measures how well the investments performed.
$$\text{Monthly Return} = \prod_{t=1}^{n} (1 + r_t) – 1$$where \( r_t \) is the daily return on business day \( t \) within the month.
Monthly Total Row — The bottom “Total” row for each month represents the cumulative compounded return across all years for that specific month. For example, a Total of 16.87% in January means that if you had invested at the start of every January across all years, your compounded gain would be 16.87%. It is not a simple average of the January figures.
Yearly Total Column — The “Total” column on the right represents the full-year compounded return for that year, calculated by chaining all monthly returns together:
$$\text{Annual Return} = \left(\prod_{m=1}^{12} (1 + r_m) – 1\right) \times 100$$where \( r_m \) is the compounded return for month \( m \).
Adding up the monthly percentages would overstate or understate the true result due to compounding effects — a month of +10% followed by -10% does not return you to zero, it leaves you at -1%.
Grand Total (bottom-right cell) — The intersection of the Total row and Total column represents the overall compounded return since inception across all years — the single number that summarizes the entire track record.
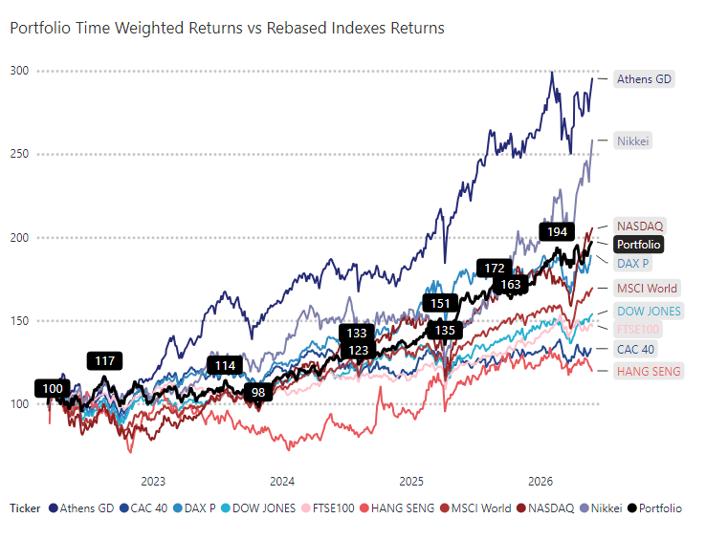
Rebased Performance (Time Series)
Each index and the portfolio are rebased to 100 at the start of each year, allowing fair year-by-year comparison regardless of absolute price levels. The formula is:
$$\text{Rebased Value}_t = 100 \times e^{\sum_{i=1}^{t} \ln(1 + r_i)}$$where \( r_i \) is the daily return on day \( i \), with the series resetting to 100 at the start of each year.
This log-return approach is mathematically equivalent to chaining daily returns and is the standard method used in performance attribution.
Investing is a long game. This dashboard is my way of keeping score honestly — not just against the market, but against myself. Thanks for stopping by.
If you want to deep dive into the mentioned indexes and benchmarks performance over the last 20-30 years, check out my Python-based multi-index stock analysis → Decoding Markets